[Python matplotlib] 그래프 X축의 범주형 항목 순서 변경하기 (changing the order of x-axis xticks)
Python 분석과 프로그래밍/Python 그래프_시각화 2022. 1. 6. 23:49이번 포스팅에서는 Python의 pandas DataFrame을 대사응로 matplotlib 그래프를 그렸을 때, X축 범주형 항목의 순서(changing the order of x-axis ticks in python matplotlib plot)를 변경하는 방법을 소개하겠습니다.
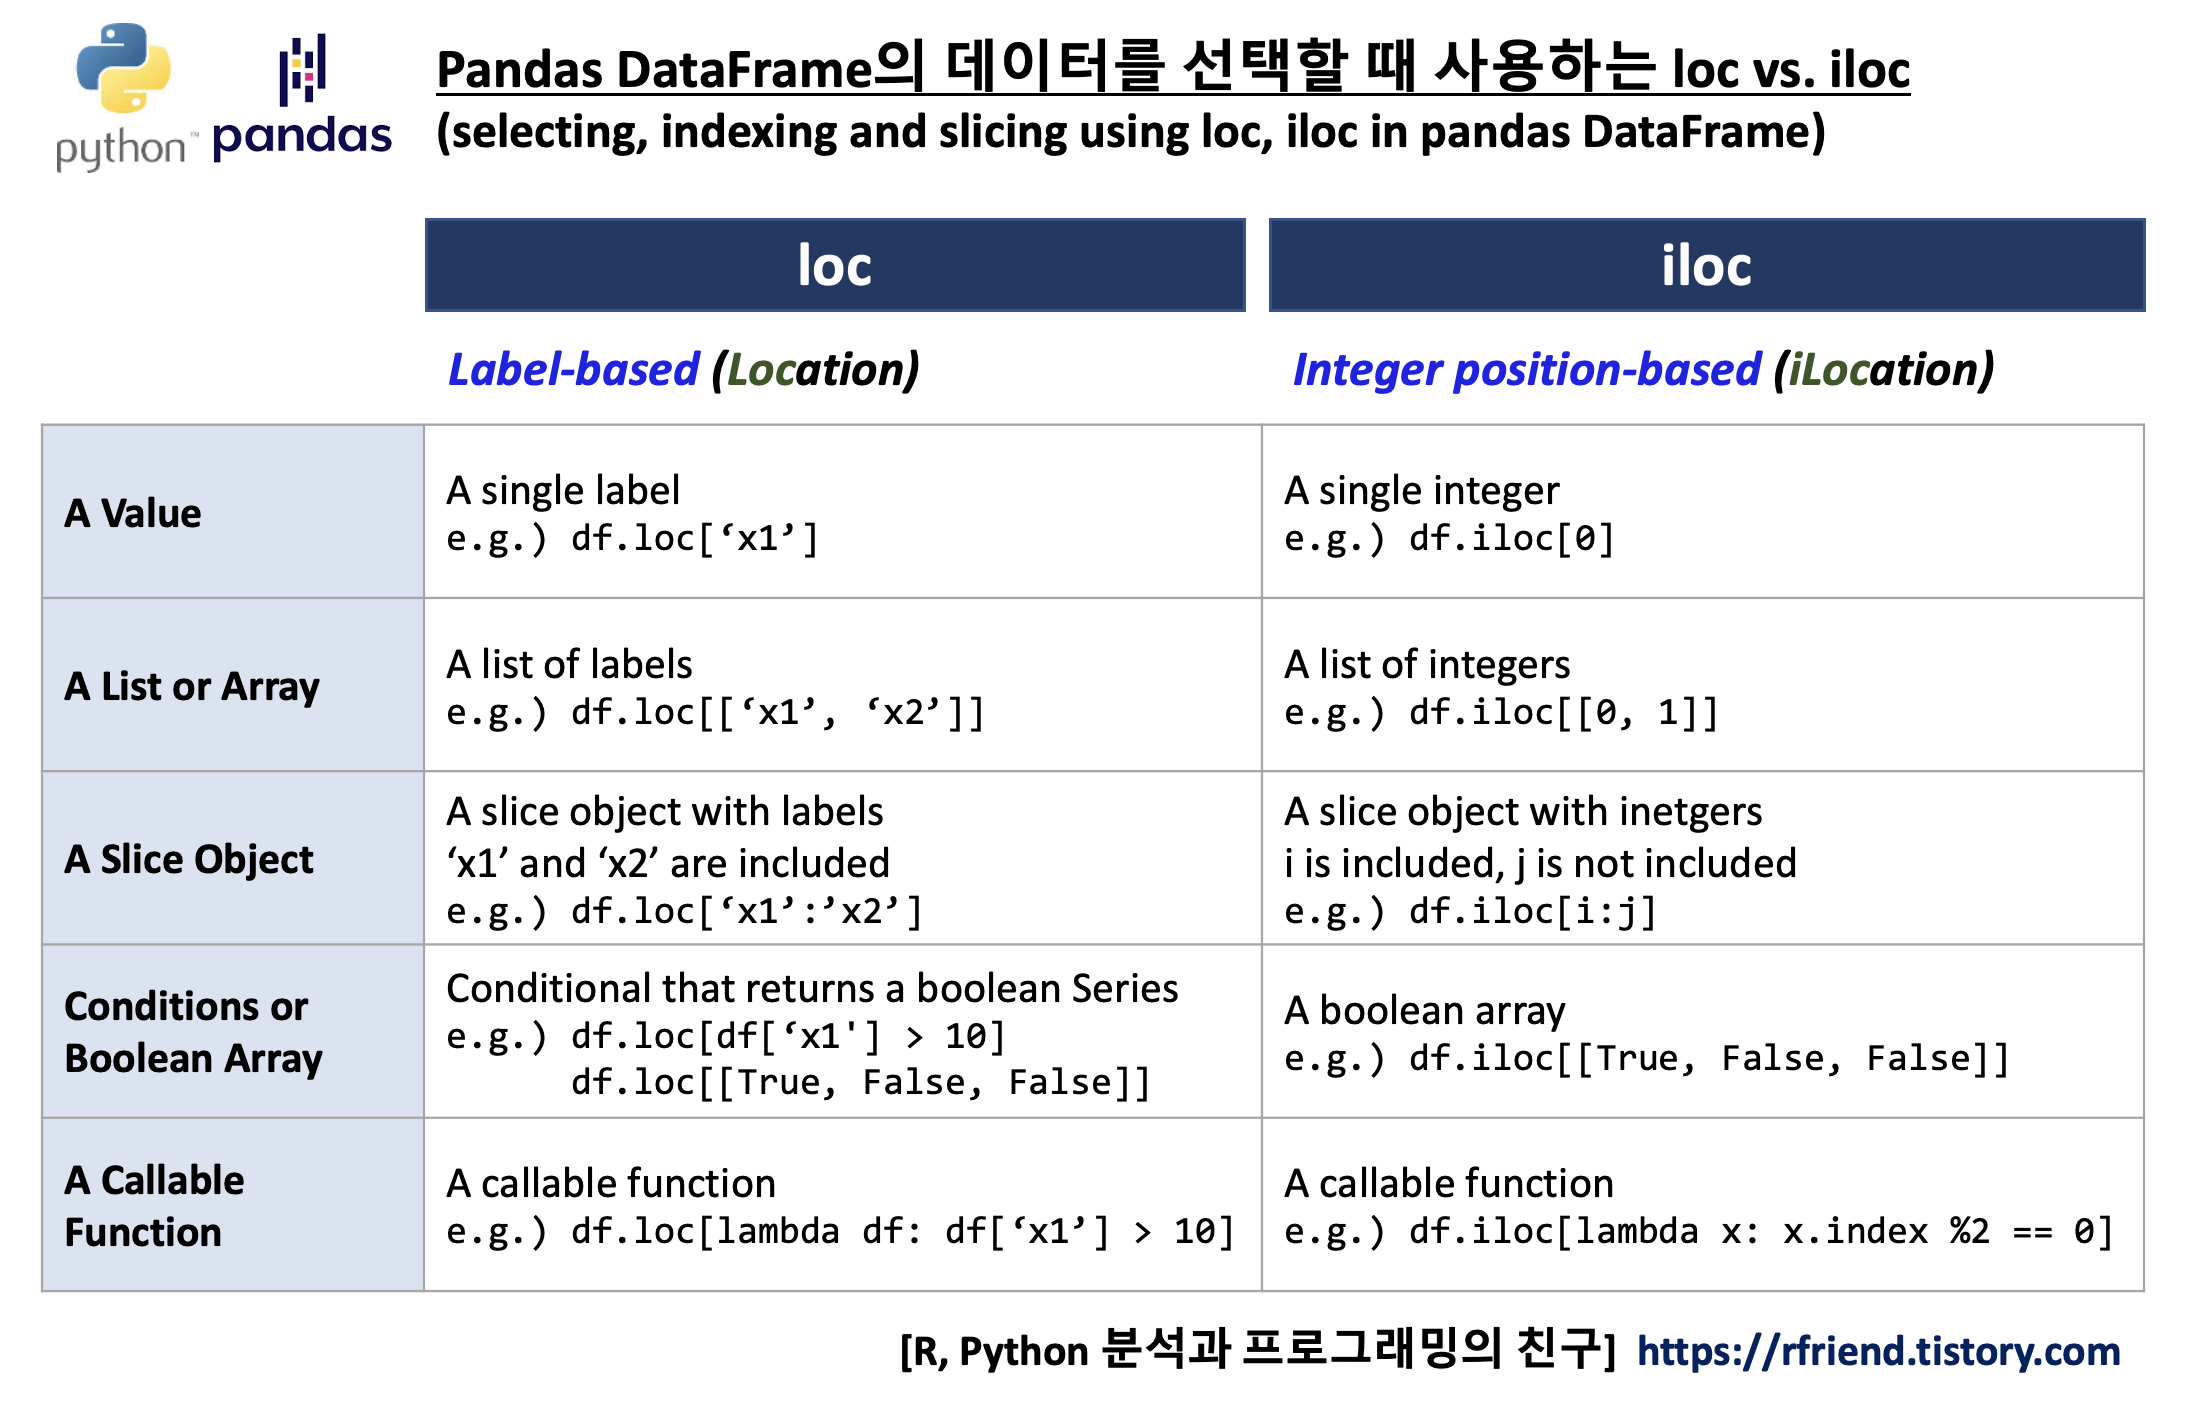
(1) pandas DataFrame의 x 축으로 사용되는 범주형 값을 loc 를 사용해 재정렬하기
(2) index 가 재정렬된 pandas.DataFrame에 대해서 matplotlib 으로 그래프 그리기
먼저, 예제로 사용할 간단한 pandas DataFrame을 만들어 보겠습니다. 요일(weekday dates) 별 값(value) 으로 구성된 DataFrame에 대해서 groupby() 연산자를 사용해서 요일별 값의 합을 집계(aggregation by weekday) 한 DataFrame을 만들었습니다.
import pandas as pd
import matplotlib.pyplot as plt

## making a sample pandas DataFrmae
df = pd.DataFrame({
    'weekday': ['Monday', 'Saturday', 'Tuesday', 'Sunday', 'Wednesday', 'Thursday',
                'Friday', 'Saturday', 'Sunday', 'Friday', 'Tuesday'],
    'value': [2, 3, 4, 2, 6, 7, 5, 2, 1, 6, 4]
})

print(df)
#       weekday  value
# 0      Monday      2
# 1    Saturday      3
# 2     Tuesday      4
# 3      Sunday      2
# 4   Wednesday      6
# 5    Thursday      7
# 6      Friday      5
# 7    Saturday      2
# 8      Sunday      1
# 9      Friday      6
# 10    Tuesday      4


## aggregation of value by weekday --> this will be used for visualization
df_agg = df.groupby('weekday').sum('value')
print(df_agg)
#            value
# weekday
# Friday        11
# Monday         2
# Saturday       5
# Sunday         3
# Thursday       7
# Tuesday        8
# Wednesday      6
(1) pandas DataFrame의 x 축으로 사용되는 범주형 값을 loc 를 사용해 재정렬하기
위에서 df.groupby('weekday').sum('value') 로 집계한 df_agg DataFrame의 결과를 보면, 알파벳(alphabet) 순서대로 요일의 순서("Friday", "Monday", "Satruday", "Sunday", "Thursday", "Tuesday", "Wednesday")가 정해져서 집계가 되었습니다. 이 DataFrame에 대해 matplotlib 으로 막대그래프를 그리면 아래와 같이 요일이 알파벳 순서대로 정렬이 된 상태에서 그래프가 그려집니다.
plt.figure(figsize=(12, 8))
plt.bar(df_agg.index, df_agg.value)
plt.title("Bar plot without reordering x-axis label", fontsize=20)
plt.xlabel("Weekday", fontsize=18)
plt.xticks(fontsize=16)
plt.show()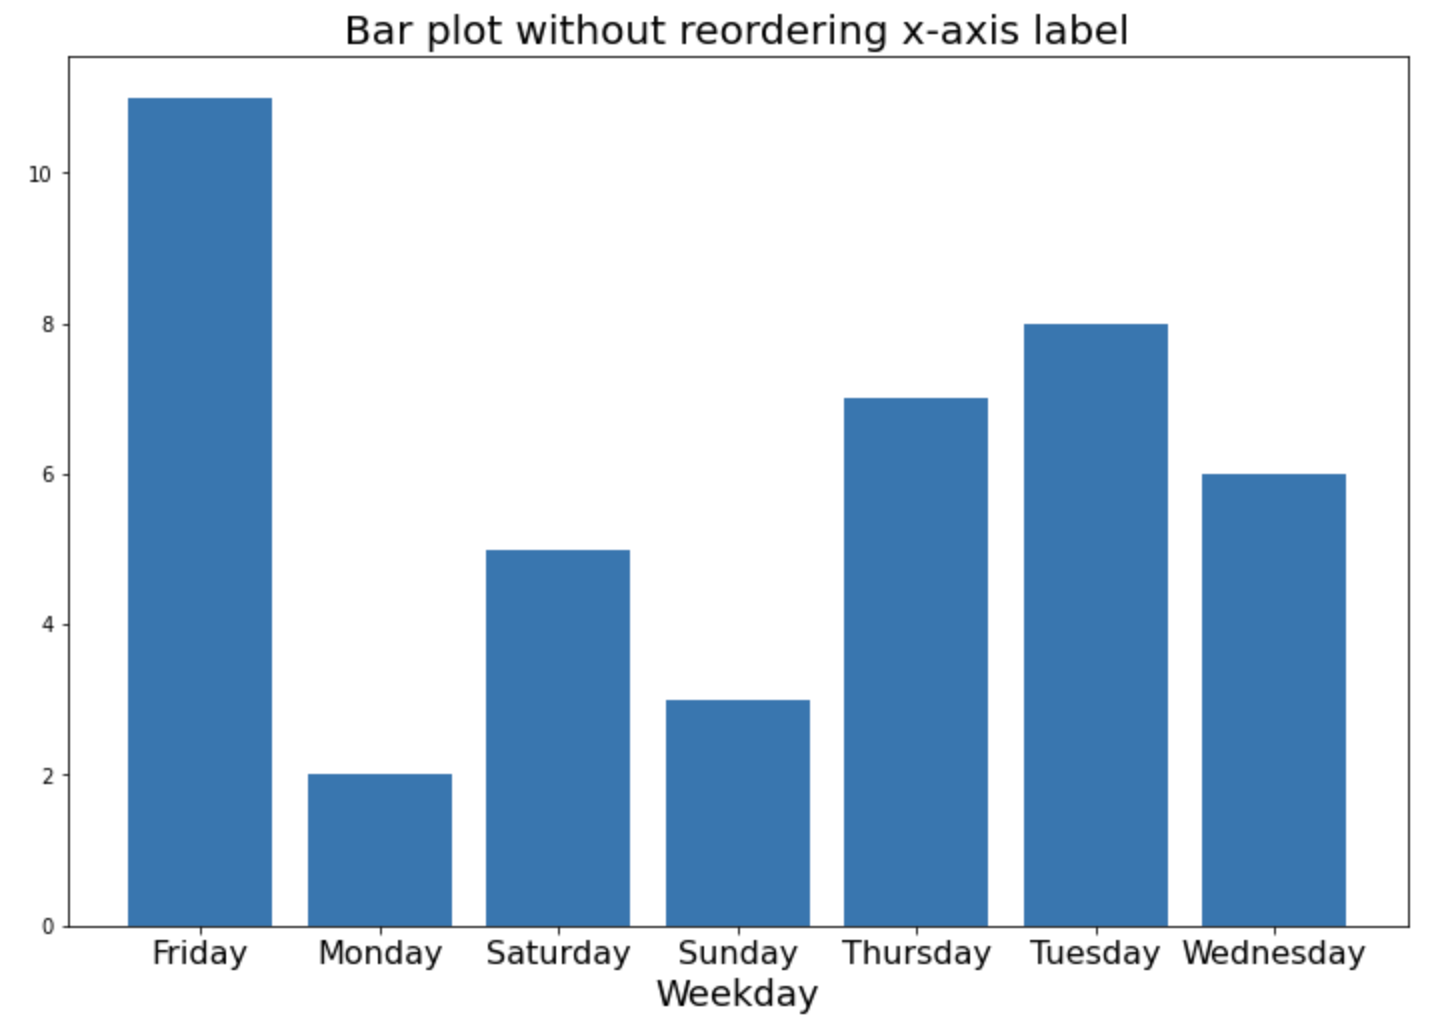
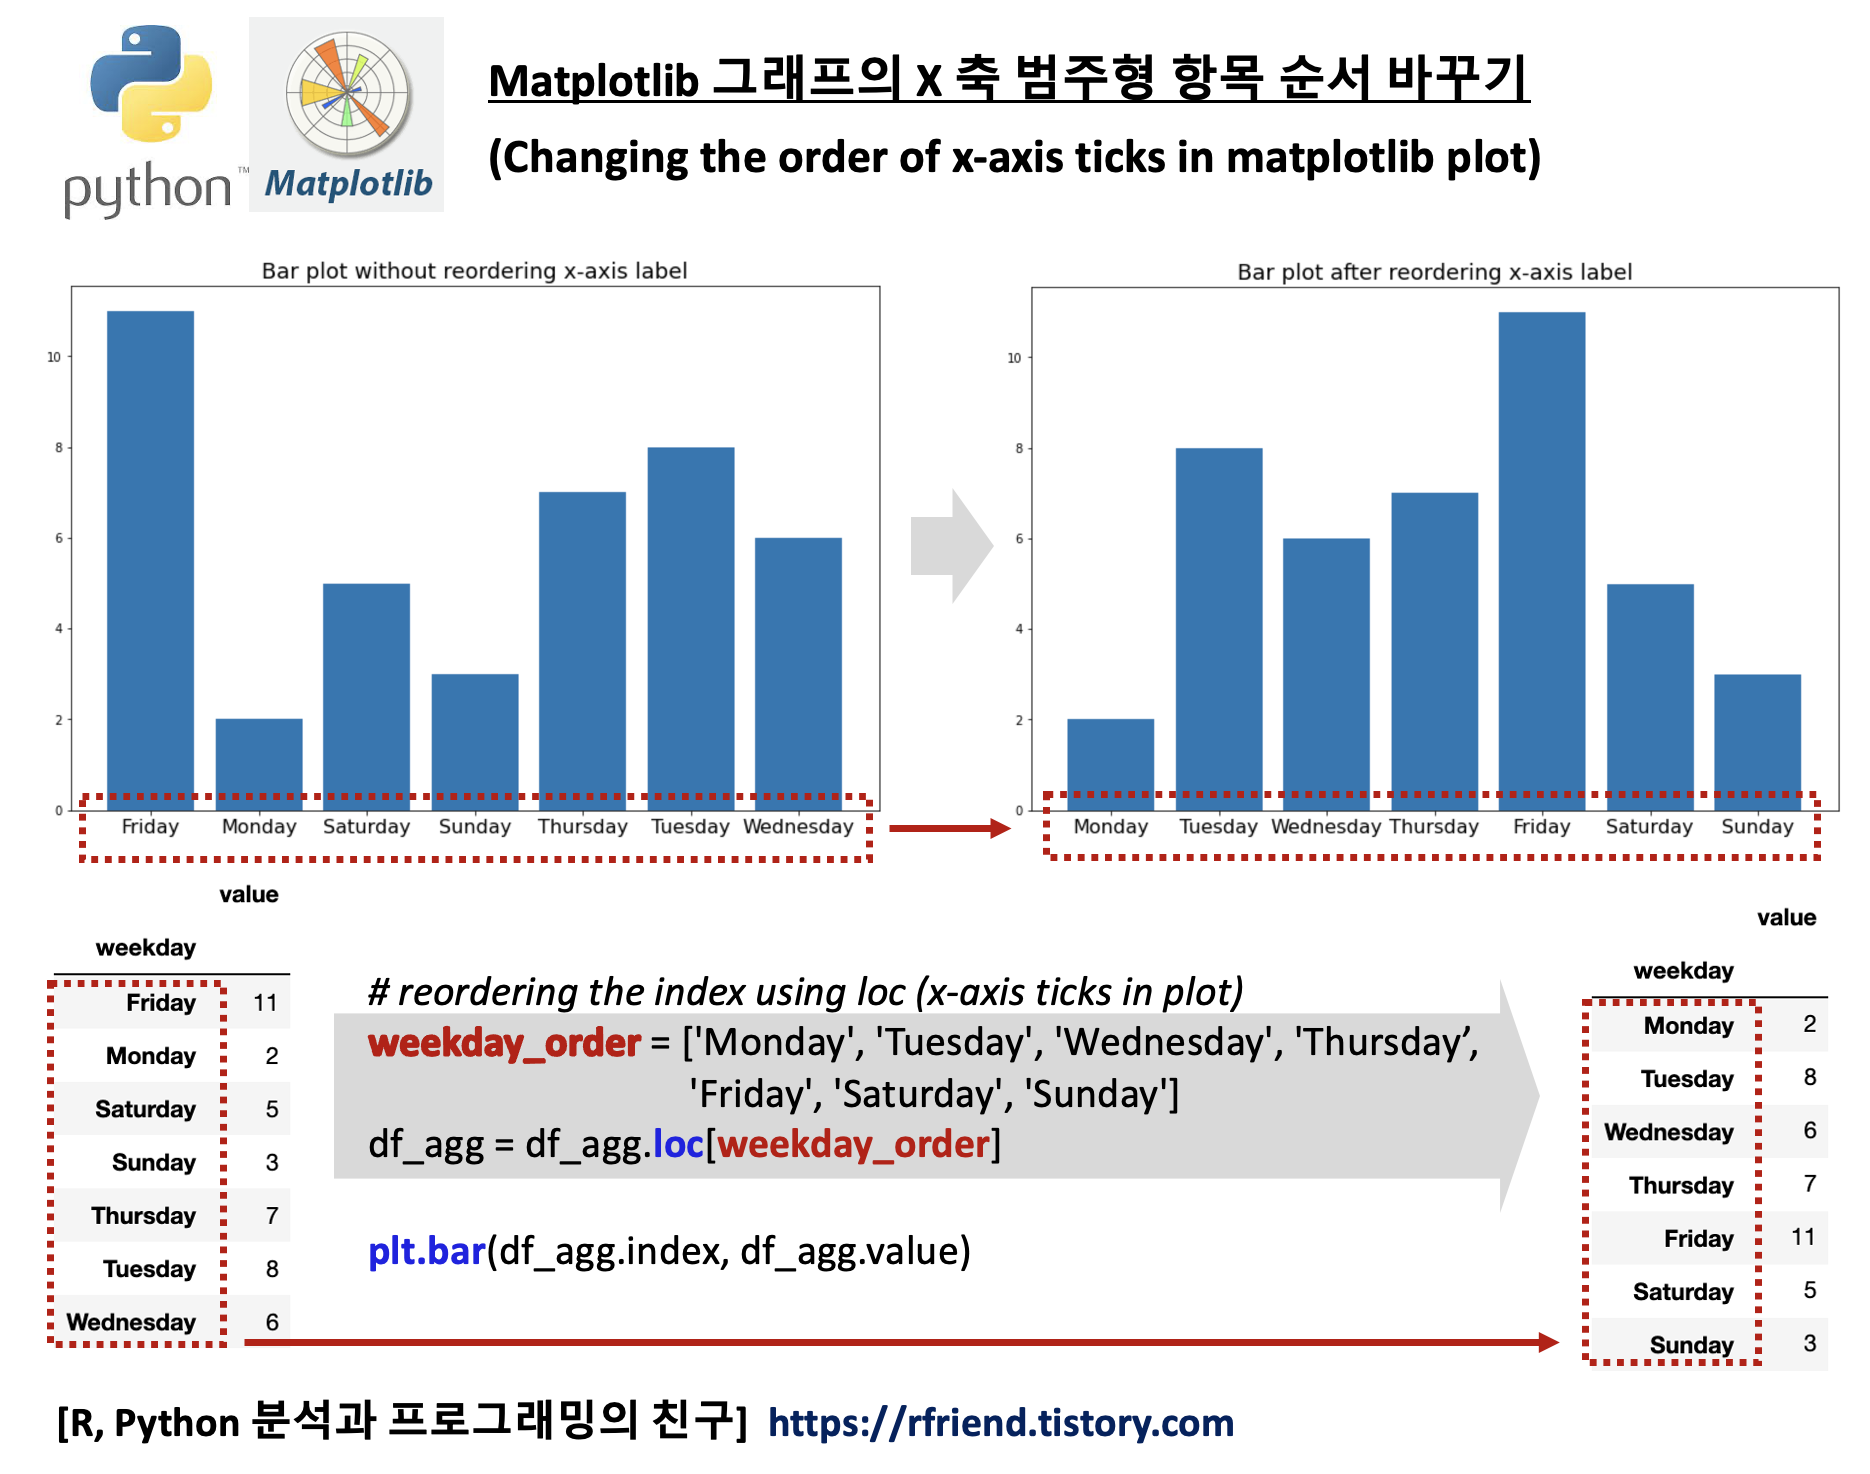
(2) index 가 재정렬된 pandas.DataFrame에 대해서 matplotlib 으로 그래프 그리기
(matplotlib 그래프의 x-axis 의 ticks 순서 바꾸기)
요일의 순서가 우리가 일상적으로 사용하는 순서와는 다르기 때문에 눈에 잘 안들어오고 거슬립니다. 이럴 때는 pandas DataFrame의 index 순서를 먼저 바꾸어주고, 순서가 재정렬된 후의 DataFrame에 대해서 matplotlib 으로 그래프를 그려주면 됩니다.
아래 예제에서는 요일(weekday)을 알파벳 순서가 아니라, 우리가 일상적으로 사용하는 ("Monday", "Tuesday", "Wednesday", "Thursday", "Friday", "Saturday", "Sunday") 의 순서로 DataFrame의 index 를 loc 를 사용해서 바꾸어 준후에, matplotlib 막대그래프(bar graph)를 그려보았습니다.
matplotlib의 X 축 레이블의 크기
## changing the order of x-axis label using loc
weekday_order = ['Monday', 'Tuesday', 'Wednesday', 'Thursday', 'Friday', 'Saturday', 'Sunday']
df_agg = df_agg.loc[weekday_order]

print(df_agg)
#            value
# weekday
# Monday         2
# Tuesday        8
# Wednesday      6
# Thursday       7
# Friday        11
# Saturday       5
# Sunday         3


## box-plot after changing the order of x-axis ticks
plt.figure(figsize=(12, 8))
plt.bar(df_agg.index, df_agg.value)
plt.title("Bar plot after reordering x-axis label", fontsize=20)
plt.xlabel("Weekday", fontsize=18)
plt.xticks(fontsize=16)
plt.show()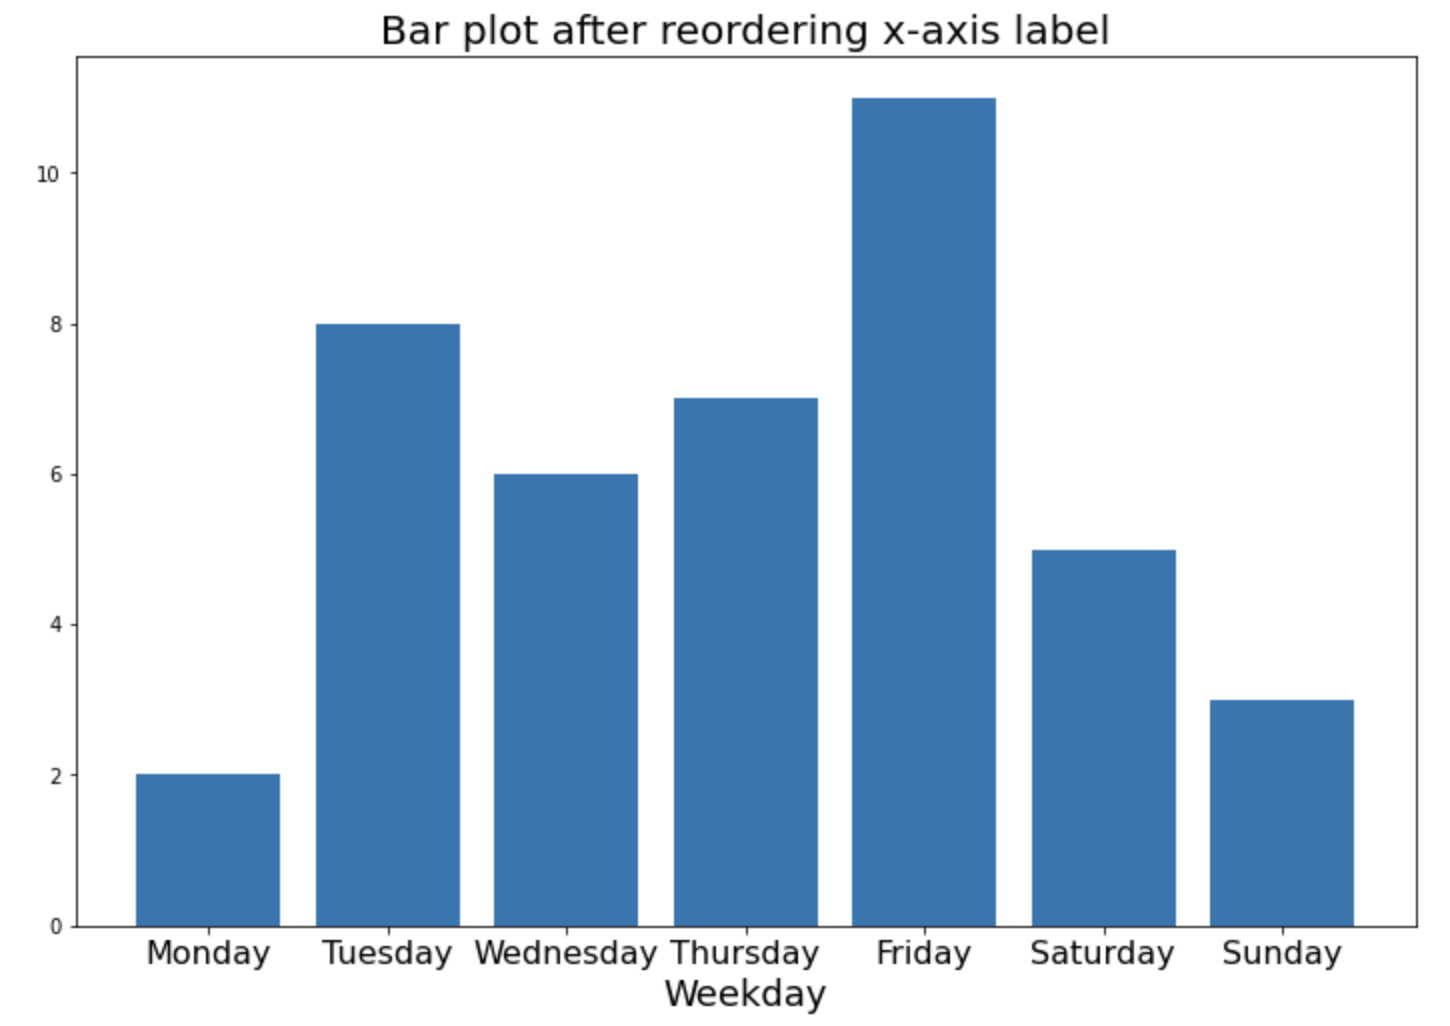
이번 포스팅이 많은 도움이 되었기를 바랍니다.
행복한 데이터 과학자 되세요! :-)

'Python 분석과 프로그래밍 > Python 그래프_시각화' 카테고리의 다른 글
| [Python] HoloViews 모듈을 사용해서 Sankey Diagram 그리기 (0) | 2022.01.23 |
|---|---|
| [Python matplotlib] numpy 2D array의 행 기준, 열 기준 백분율을 구해서 히트맵 그리기 (0) | 2022.01.16 |
| [Python matplotlib] 범례 추가하기 (adding a legend) (0) | 2021.11.27 |
| [Python matplotlib] 눈금(ticks)과 눈금 이름(tick label), 축 이름(label), 제목( title) 설정하기 (0) | 2021.11.27 |
| [Python matplotlib] 여러개의 하위 플롯 간격을 조절해서 붙이고, X축, Y축을 공유해서 시각화하기 (0) | 2021.11.21 |