이번 포스팅에서는 Jupyter Notebook 의 기본 사용법 중에서 


(1) Jupyter Notebook Cell 의 모든 결과 지우기 

    : Cell >> All Output >> Clear

(2) Jupyter Notebook 커널 새로 시작하고, 모든 Cell 실행하기

    : Kernel >> Restart & Run All


방법에 대해서 소개하겠습니다. 


(1) Jupyter Notebook Cell 의 모든 결과 지우기

    : Cell >> All Output >> Clear


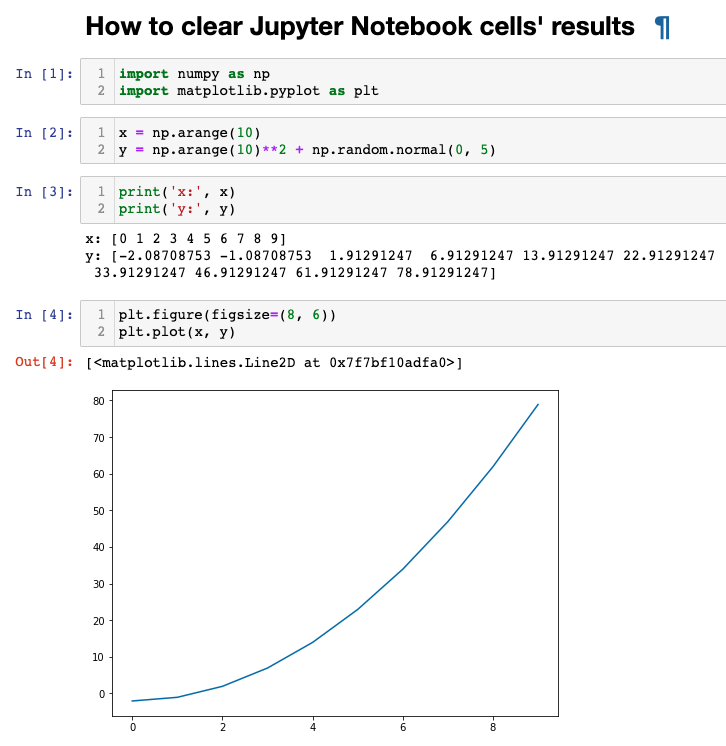
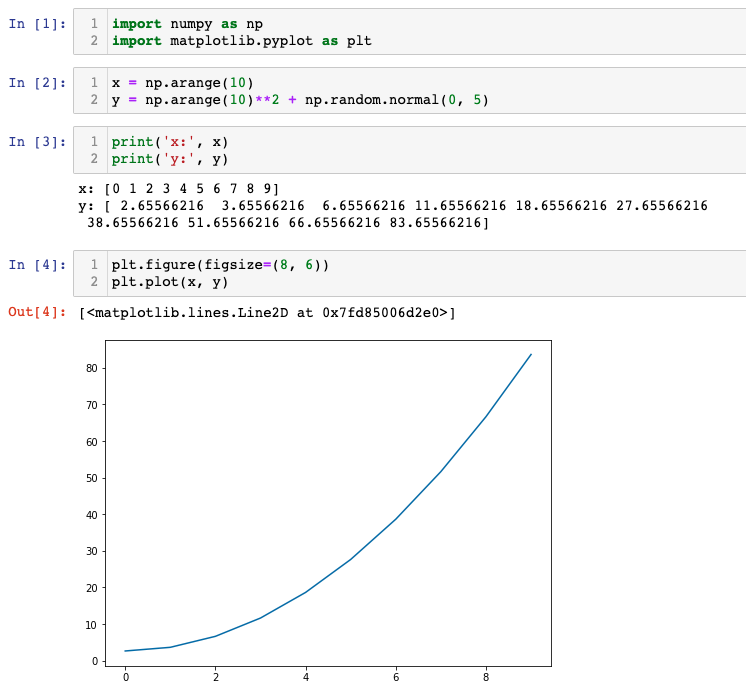
아래에 예제로 사용할 간단한 Jupyter Notebook 을 만들어보았습니다.

x, y 객체를 프린트도 해보고, 선 그래프도 그려보았습니다.  

Jupyter Notebook Cell's Results


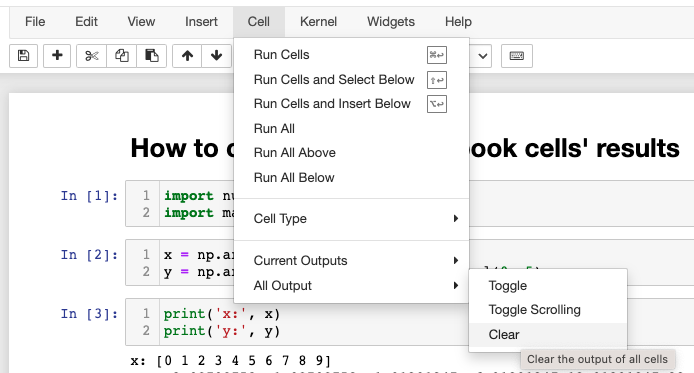
이제 Cell >> All Output >> Clear 순서로 메뉴를 선택해서 Cell의 모든 결과를 지워보겠습니다. 

(Clear the output of all cells in Jupyter Notebook) 


Jupyter Notebook - Cell - All Output - Clear


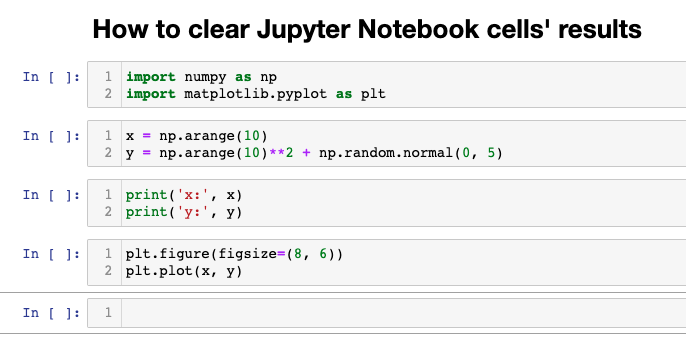
Cell >> All Output >> Clear 의 순서대로 메뉴를 선택해서 실행하면 아래처럼 Cell 의 결과가 모두 지워져서 깨끗해졌습니다. 

Jupyter Notebook - Cleared All Outputs in Cells


(2) Jupyter Notebook 커널 새로 시작하고, 모든 Cell 실행하기

    : Kernel >> Restart & Run All


위의 (1)번과는 반대로, 이번에는 Kernel 을 새로 시작(Kernel Restart)하고 모든 Cell을 새로 실행(Run All)해보겠습니다. 

(Kernel >> Restart & Run All)

Jupyter Notebook - Restart & Run All


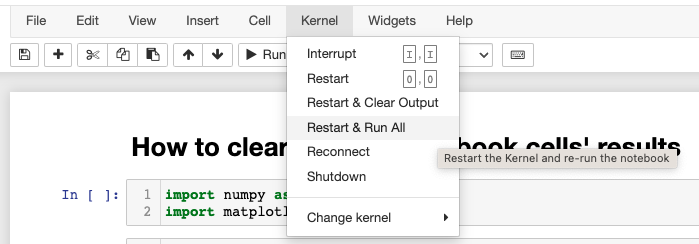
아래와 같은 팝업 창이 뜨면 "Restart and Run All Cells" 메뉴를 선택해서 클릭해주면 됩니다. 


Jupyter Notebook - Restart and Run All Cells


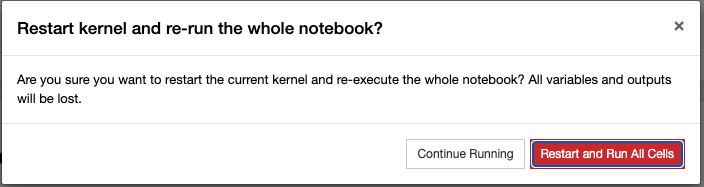
그러면, 아래처럼 커널이 새로 시작하고, 모든 셀이 순서대로 다시 실행이 됩니다. 

Jupyter Notebook - Restart and Run All Cells - Results


이번 포스팅이 많은 도움이 되었기를 바랍니다. 

행복한 데이터 과학자 되세요. 


728x90
반응형
Posted by Rfriend
,

이번 포스팅에서는 Jupyter Notebook을 사용하는데 있어 자주 쓰는 것은 아니지만 한번 쓰려고 하면 방법을 찾으려고 하면 또 시간을 빼앗기곤 하는, 그래서 어디에 메모해두었다가 필요할 때 꺼내쓰기에 아기자기한 팁들을 모아보았습니다. 


(1) Jupyter Notebook cell 너비 설정하기

(2) Jupyter Notebook에서 DataFrame 칼럼 최대 너비 설정하기

(3) Jupyter Notebook에서 DataFrame 내 텍스트를 왼쪽으로 정렬하기

(4) Jupyter Notebook에서 DataFrame 소수점 자리수 설정하기

(5) Jupyter Notebook에서 matplotlib plot 기본 옵션 설정하기 (figure size, line width, color, grid)

(6) Jupyter Notebook에서 출력하는 행의 최대개수 설정하기 (number of max rows) 


 (1) Jupyter Notebook cell 너비 설정하기 (setting cell width in Jupyter Notebook)


아래 코드의 부분의 숫자를 바꾸어주면 됩니다.  


from IPython.core.display import display, HTML


display(HTML("<style>.container { width: 50% !important; }</style>"))


 (2) Jupyter Notebook에서 DataFrame 칼럼 최대 너비 설정하기 

     (setting the max-width of DataFrame's column in Jupyter Notebook)


import pandas as pd

pd.set_option('display.max.colwidth', 10)


df = pd.DataFrame({'a': [100000000.0123, 20000000.54321], 

                  'b': ['abcdefghijklmnop', 'qrstuvwxyz']})


df


Out[2]:
  a b
0 1.0000... abcdef...
1 2.0000... qrstuv...


pd.set_option('display.max.colwidth', 50)
 
df
 
Out[3]:
 
 
  a b
0 1.000000e+08 abcdefghijklmnop
1 2.000000e+07 qrstuvwxyz


 (3) Jupyter Notebook에서 DataFrame 내 텍스트를 왼쪽으로 정렬하기 

     (align text of pandas DataFrame to left in Jupyter Notebook)


dfStyler = df.style.set_properties(**{'text-align': 'left'})

dfStyler.set_table_styles([dict(selector='th', 

                                props=[('text-align', 'left')])])


Out[4]:
  a b
0 1e+08 abcdefghijklmnop
1 2e+07 qrstuvwxyz


 (4) Jupyter Notebook에서 DataFrame 소수점 자리수 설정하기

     (setting the decimal point format of pandas DataFrame in Jupyter Notebook)


아래에 예시로 지수형 표기를 숫자형 표기로 바꾸고, 소수점 2째자리까지만 나타내도록 숫자 표기 포맷을 설정해보겠습니다. 


import pandas as pd

pd.options.display.float_format = '{:.2f}'.format


df


Out[6]:
  a b
0 100000000.01 abcdefghijklmnop
1 20000000.54 qrstuvwxyz


 (5) Jupyter Notebook에서 matplotlib plot 기본 옵션 설정하기 

    (setting figure size, line width, color, grid of matplotlib plot in Jupyter Notebook)


matplotlib.pyplot 의 plt.rcParams[] 를 사용하여 그래프 크기, 선 너비, 선 색깔, 그리드 포함 여부 등을 설정할 수 있습니다. 


# matplotlib setting

import matplotlib.pylab as plt

%matplotlib inline


plt.rcParams["figure.figsize"] = (6, 5)

plt.rcParams["lines.linewidth"] = 2

plt.rcParams["lines.color"] = 'r'

plt.rcParams["axes.grid"] = True


# simple plot

x = [1, 2, 3, 4, 5]

y = [2, 3.5, 5, 8, 9]


plt.plot(x, y)

plt.show()


 (6) Jupyter Notebook에서 출력하는 최대 행의 개수 설정하기 (number of max rows)


Jupyter Notebook 셀에서 DataFrame 인쇄 시에 기본 설정은 행의 개수가 많을 경우 중간 부분이 점선으로 처리 ("...")되어 건너뛰고, 처음 5개행과 마지막 5개 행만 선별해서 보여줍니다.   


# if there are many rows, JN does not print all rows

import pandas as pd
import numpy as np


df = pd.DataFrame(np.arange(200).reshape(100, 2))
df


그런데, 필요에 따라서는 전체 행을 프린트해서 눈으로 확인해봐야할 때도 있습니다. 이럴 경우 Jupyter Notebook에서 출력하는 최대 행의 개수 (the number of max rows in Jupyter Notebook) 를 설정할 수 있습니다. 위의 예에서 5번째 행부터 점선으로 처리되어 건너뛰고 안보여지던 행이, pd.set_option('display.max_rows', 100) 으로 최대 인쇄되는 행의 개수를 100개로 늘려서 설정하니 이번에는 100개 행이 전부 다 인쇄되어 볼 수 있습니다. 


# setting the number of maximum rows in Jupyter Notebook

import pandas as pd

pd.set_option('display.max_rows', 100)

df


 (7) Jupyter Notebook에서 출력하는 최대 열의 개수 설정하기 (number of max columns)


Jupyter Notebook 셀에서 DataFrame 인쇄 시에 기본 설정은 열의 개수가 20개를 넘어가면 중간 부분이 점선으로 처리 ("...")되어 건너뛰고, 나머지 20개만 출력을 해줍니다.  아래의 화면 캡쳐 예시처럼 중간 열 부분의 결과가 "..." 으로 가려져있어서 확인할 수가 없습니다. 


이럴 경우에 pandas.set_option('display.max.columns', col_num) 옵션을 사용하여 화면에 보여주는 최대 열의 개수 (maximum number of columns)"를 옵션으로 설정해줄 수 있습니다.   위에서는 ... 으로 처리되었던 열10 ~ 열12 가 아래에서는 제대로 jupyter notebook에 출력되었네요!


# setting the maximum number of columns in jupyter notebook display

import pandas as pd


pd.set_option('display.max.columns', 50) # set the maximum number whatever you want


많은 도움이 되었기를 바랍니다. 

이번 포스팅이 도움이 되었다면 아래의 '공감~

'를 꾹 눌러주세요. :-)


728x90
반응형
Posted by Rfriend
,