[Python] 의사결정나무 시각화 (Visualization of Decision Tree using Python)
Python 분석과 프로그래밍/Python 그래프_시각화 2022. 8. 22. 16:28이번 포스팅에서는 Python 을 이용해서 의사결정나무 (Decision Tree) 를 시각화하는 3가지 방법을 소개하겠습니다.
(1) sklearn.tree.export_text 메소드를 이용해서 의사결정나무를 텍스트로 인쇄하기 (text representation)
(2) sklearn.tree.plot_tree 메소드와 matplotlib 을 이용해서 의사결정나무 시각화
(3) sklearn.tree.export_graphviz 메소드와 graphviz 를 이용해서 의사결정나무 시각화
먼저, 예제로 사용할 iris 데이터셋과 필요한 모듈을 불어오겠습니다.
import numpy as np
import pandas as pd
import matplotlib.pyplot as plt

df = pd.DataFrame({
    'x1': [1, 2, 2, 2, 2, 3, 3, 4, 5, 5],
    'x2': [2, 2, 3, 4, 5, 4, 6, 3, 2, 5],
    'cat': [0, 1, 1, 0, 0, 1, 0, 1, 1, 0]
})


df

# x1	x2	cat
# 0	1	2	0
# 1	2	2	1
# 2	2	3	1
# 3	2	4	0
# 4	2	5	0
# 5	3	4	1
# 6	3	6	0
# 7	4	3	1
# 8	5	2	1
# 9	5	5	0


## scatter plot
import seaborn as sns

plt.figure(figsize=(7, 7))
sns.scatterplot(x='x1', y='x2', hue='cat', style='cat', s=100, data=df)
plt.show()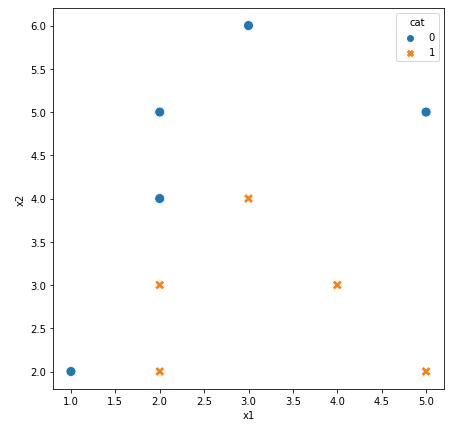
(0) sklearn.tree 메소드를 이용해서 의사결정나무(Decision Tree) 모델 훈련하기
from sklearn.tree import DecisionTreeClassifier
from sklearn.model_selection import cross_val_score
from sklearn import tree

## getting X, y values
X = df[['x1', 'x2']]
y = df['cat']

## initiating DecisionTreeClassifer method
dt_clf = DecisionTreeClassifier(random_state = 1004)


## fitting a decision tree classifier
dt_clf_model = dt_clf.fit(X, y)


## feature importances
dt_clf_model.feature_importances_

#array([0.43809524, 0.56190476])
(1) sklearn.tree.export_text 메소드를 이용해서 의사결정나무를 텍스트로 인쇄하기 (text representation)
의사결정나무 모델을 적합한 후에 사용자 인터페이스가 없는 애플리케이션에서 로그(log) 텍스트로 모델 적합 결과를 확인할 때 사용할 수 있습니다. 또는 의사결정나무의 적합된 룰을 SQL 로 구현하여 운영 모드로 적용하고자 할 때 아래처럼 텍스트로 인쇄를 하면 유용하게 사용할 수 있습니다.
## Text Representation
dt_clf_model_text = tree.export_text(dt_clf_model)

print(dt_clf_model_text)

|--- feature_1 <= 4.50
|   |--- feature_0 <= 1.50
|   |   |--- class: 0
|   |--- feature_0 >  1.50
|   |   |--- feature_1 <= 3.50
|   |   |   |--- class: 1
|   |   |--- feature_1 >  3.50
|   |   |   |--- feature_0 <= 2.50
|   |   |   |   |--- class: 0
|   |   |   |--- feature_0 >  2.50
|   |   |   |   |--- class: 1
|--- feature_1 >  4.50
|   |--- class: 0
(2) sklearn.tree.plot_tree 메소드와 matplotlib 을 이용해서 의사결정나무 시각화
(3)번 처럼 Graphviz 를 설치하지 않아도, matplotlib 을 사용해서 간편하게 의사결정나무를 시각화 할 때 유용합니다. 편리한 대신에 (3)번 Graphviz 대비 자유도가 떨어지는 단점이 있습니다.
## Plot Tree with plot_tree
fig = plt.figure(figsize=(15, 8))
_ = tree.plot_tree(dt_clf_model,
                  feature_names=['x1', 'x2'],
                  class_names=['0', '1'],
                  filled=True)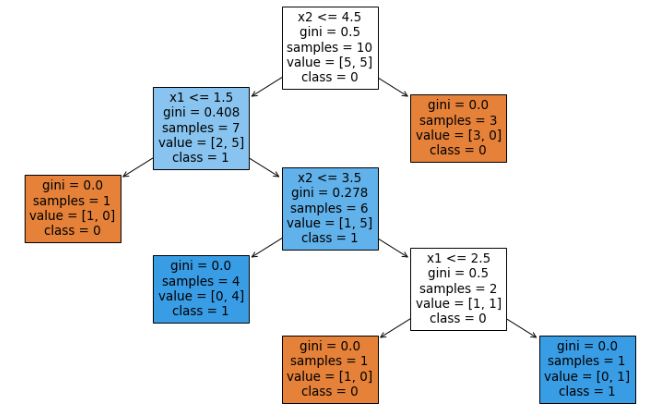
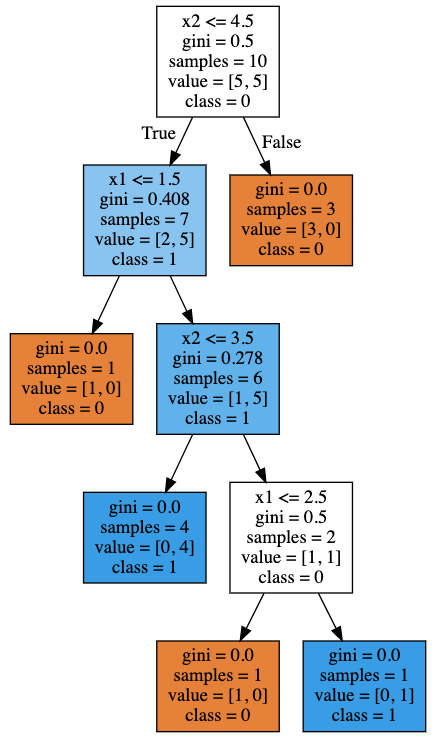
(3) sklearn.tree.export_graphviz 메소드와 graphviz 를 이용해서 의사결정나무 시각화
Graphviz 의 시각화 기능을 fully 사용할 수 있으므로 매우 강력한 시각화 방법이라고 할 수 있습니다.
Graphviz 설치하고 Decision Tree 시각화하기는 https://rfriend.tistory.com/382 를 참고하세요.
DOT language 에 대해서는 https://graphviz.org/doc/info/lang.html 를 참고하세요.
## Visualizing Tree using Graphviz
from sklearn import tree
import graphviz

## exporting tree in DOT format
## refer to: https://scikit-learn.org/stable/modules/generated/sklearn.tree.export_graphviz.html
tree_dot = tree.export_graphviz(
    dt_clf_model,
    feature_names=['x1', 'x2'],
    class_names=['0', '1'],
    filled=True
)


## draw graph using Graphviz
dt_graph = graphviz.Source(tree_dot, format='png')
dt_graph
이번 포스팅이 많은 도움이 되었기를 바랍니다.
행복한 데이터 과학자 되세요~!