이번 포스팅에서는 Python matplotlib 모듈을 사용해서 그래프를 그렸을 때 범례를 추가(adding a legend on the Axes)하는 4가지 방법을 소개하겠습니다. 그리고 범례의 위치, 범례 글자 크기, 범례 배경색, 범례 테두리 색, 범례 그림자 등을 설정하는 방법을 소개하겠습니다.
(1) 범례 추가하기 (adding a legend on the Axes)
: legend(), legend(handles, labels), legend(handles=handles), legend(labels)
(2) 범례 스타일 설정하기
: location, fontsize, facecolor, edgecolor, shadow
(1) 범례 추가하기 (adding a legend on the Axes)
matplotlib 으로 그래프를 그린 후 범례를 추가하는 방법에는 (1-1) legend(), (1-2) line.set_label(), (1-3) legend(handles, labels), (1-4) legend(handles=handles) 의 4가지 방법이 있습니다. 이중에서 그래프를 그릴 때 label 을 입력해주고, 이어서 ax.legend() 나 plt.legend() 를 실행해서 자동으로 범례를 만드는 방법이 가장 쉽습니다. 차례대로 4가지 방법을 소개하겠습니다. 결과는 모두 동일하므로 범례가 추가된 그래프는 (1-1)번에만 소개합니다.
먼저, 아래의 2개 방법은 자동으로 범례를 탐지해서 범례를 생성해주는 예제입니다.
(1-1) ax.plot(label='text...') --> ax.legend() 또는 plt.legend()
import numpy as np
import matplotlib.pyplot as plt

np.random.seed(1)
x = np.arange(100)
y1 = np.random.normal(0, 1, 100)
y2 = np.random.normal(0, 1, 100).cumsum()

## 1. Automatic detection of elements to be shown in the legend
## 1-1. label
fig = plt.figure(figsize=(12, 8))
ax = fig.add_subplot(1, 1, 1)

## labels: A list of labels to show next to the artists.
ax.plot(x, y1, 'b-', label='Company 1')
ax.plot(x, y2, 'r--', label='Company 2')
ax.legend()
plt.show()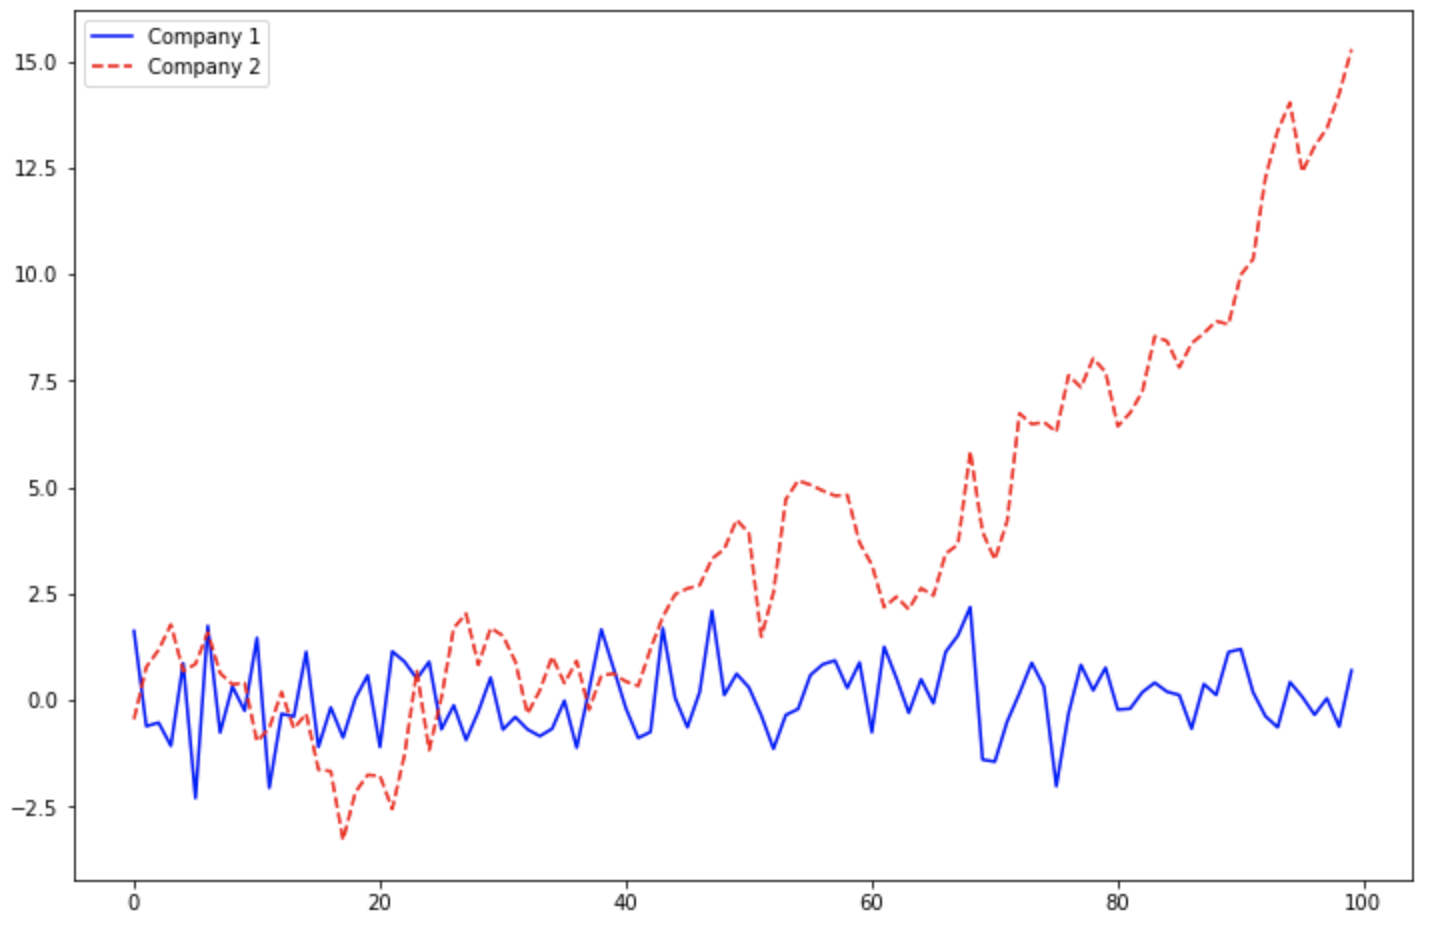
(1-2) line.set_label('text...') --> ax.legend()
## 1-2. line.set_label()

fig = plt.figure(figsize=(12, 8))
ax = fig.add_subplot(1, 1, 1)

line, = ax.plot(x, y1, 'b-')
line.set_label('Company 1')

line, = ax.plot(x, y2, 'r--')
line.set_label('Company 2')

ax.legend()
plt.show()
위의 두 방법은 범례를 자동 탐지해서 생성해줬다면, 아래의 방법부터는 명시적으로 범례의 handles (선 모양과 색깔 등) 와 labels (범례 이름)를 지정해줍니다.
(1-3) ax.legend(handles, labels)
## 2. Explicitly listing the artists and labels in the legend
## to pass an iterable of legend artists followed by an iterable of legend labels respectively
fig = plt.figure(figsize=(12, 8))
ax = fig.add_subplot(1, 1, 1)

line1, = ax.plot(x, y1, 'b-')
line2, = ax.plot(x, y2, 'r--')

ax.legend([line1, line2], ['Company 1', 'Company 2'])
plt.show()
(1-4) ax.legend(handles=handles)
## 3. Explicitly listing the artists in the legend
## the labels are taken from the artists' label properties.
fig = plt.figure(figsize=(12, 8))
ax = fig.add_subplot(1, 1, 1)

line1, = ax.plot(x, y1, 'b-', label='Company 1')
line2, = ax.plot(x, y2, 'r--', label='Company 2')

## handles: A list of Artists (lines, patches) to be added to the legend.
ax.legend(handles=[line1, line2])
plt.show()
(2) 범례 스타일 설정하기
: location, fontsize, facecolor, edgecolor, shadow
범례의 위치(location) 을 지정하려면 loc 매개변수에 location strings 인 'best', 'upper right', 'upper left', 'lower left', 'lower right', 'right', 'center left', 'center right', 'lower center', 'upper center', 'center' 중에서 하나를 선택해서 입력해주면 됩니다. 기본설정값은 loc='best' 로서 컴퓨터가 알아서 가장 적절한 여백을 가지는 위치에 범례를 생성해주는데요, 나름 똑똑하게 잘 위치를 선택해서 범례를 추가해줍니다.
그밖에 범례의 폰트 크기(fontsize), 범례의 배경 색깔(facecolor, 기본설정값은 'white'), 범례의 테두리선 색깔(edgecolor), 범례 상자의 그림자 여부(shadow, 기본설정값은 'False') 등도 사용자가 직접 지정해줄 수 있습니다. (굳이 범례의 스타일을 꾸미는데 시간과 노력을 많이 쏟을 이유는 없을 것 같기는 합니다만....^^;)
fig = plt.figure(figsize=(12, 8))
ax = fig.add_subplot(1, 1, 1)

ax.plot(x, y1, 'b-', label='Company 1')
ax.plot(x, y2, 'r--', label='Company 2')
ax.legend(
    ## location strings
    ## : 'best', 'upper right', 'upper left', 'lower left', 'lower right'
    ##   'right', 'center left', 'center right', 'lower center', 'upper center', 'center'
    loc='center left', # default: loc='best'
    ## fontsize
    ## # 'xx-small','x-small','small','medium','x-large','xx-large'
    fontsize='large',
    facecolor='yellow', # background color
    edgecolor='black',
    shadow=True) # shadow behind the legend if True

ax.set_title('Adding a Legend with color and shadow', fontsize=18)
plt.show()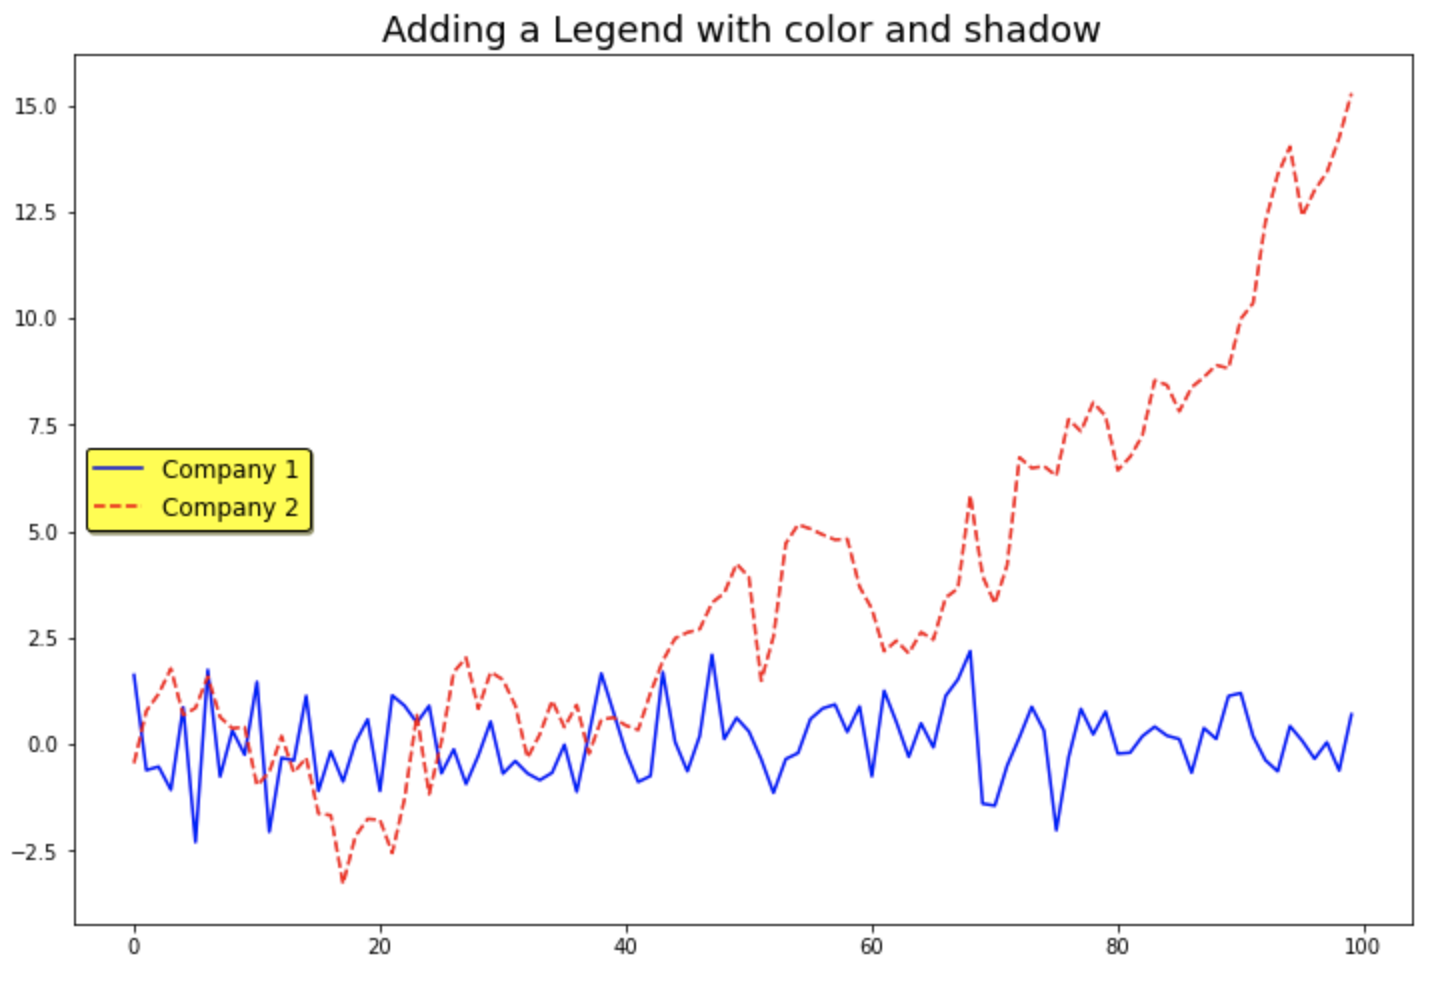
[ Reference ]
* matplotlib.pyplot.legend() : https://matplotlib.org/stable/api/_as_gen/matplotlib.pyplot.legend.html
이번 포스팅이 많은 도움이 되었기를 바랍니다.
행복한 데이터 과학자 되세요. :-)