[Python pandas] 그룹별로 누적 비율을 구한 후 분위수 위치 구하기 (calculating the cumulative proportion, getting indices for quantile p by groups)
Python 분석과 프로그래밍/Python 데이터 전처리 2021. 11. 16. 18:42이번 포스팅에서는 Python pandas 의 DataFrame에서
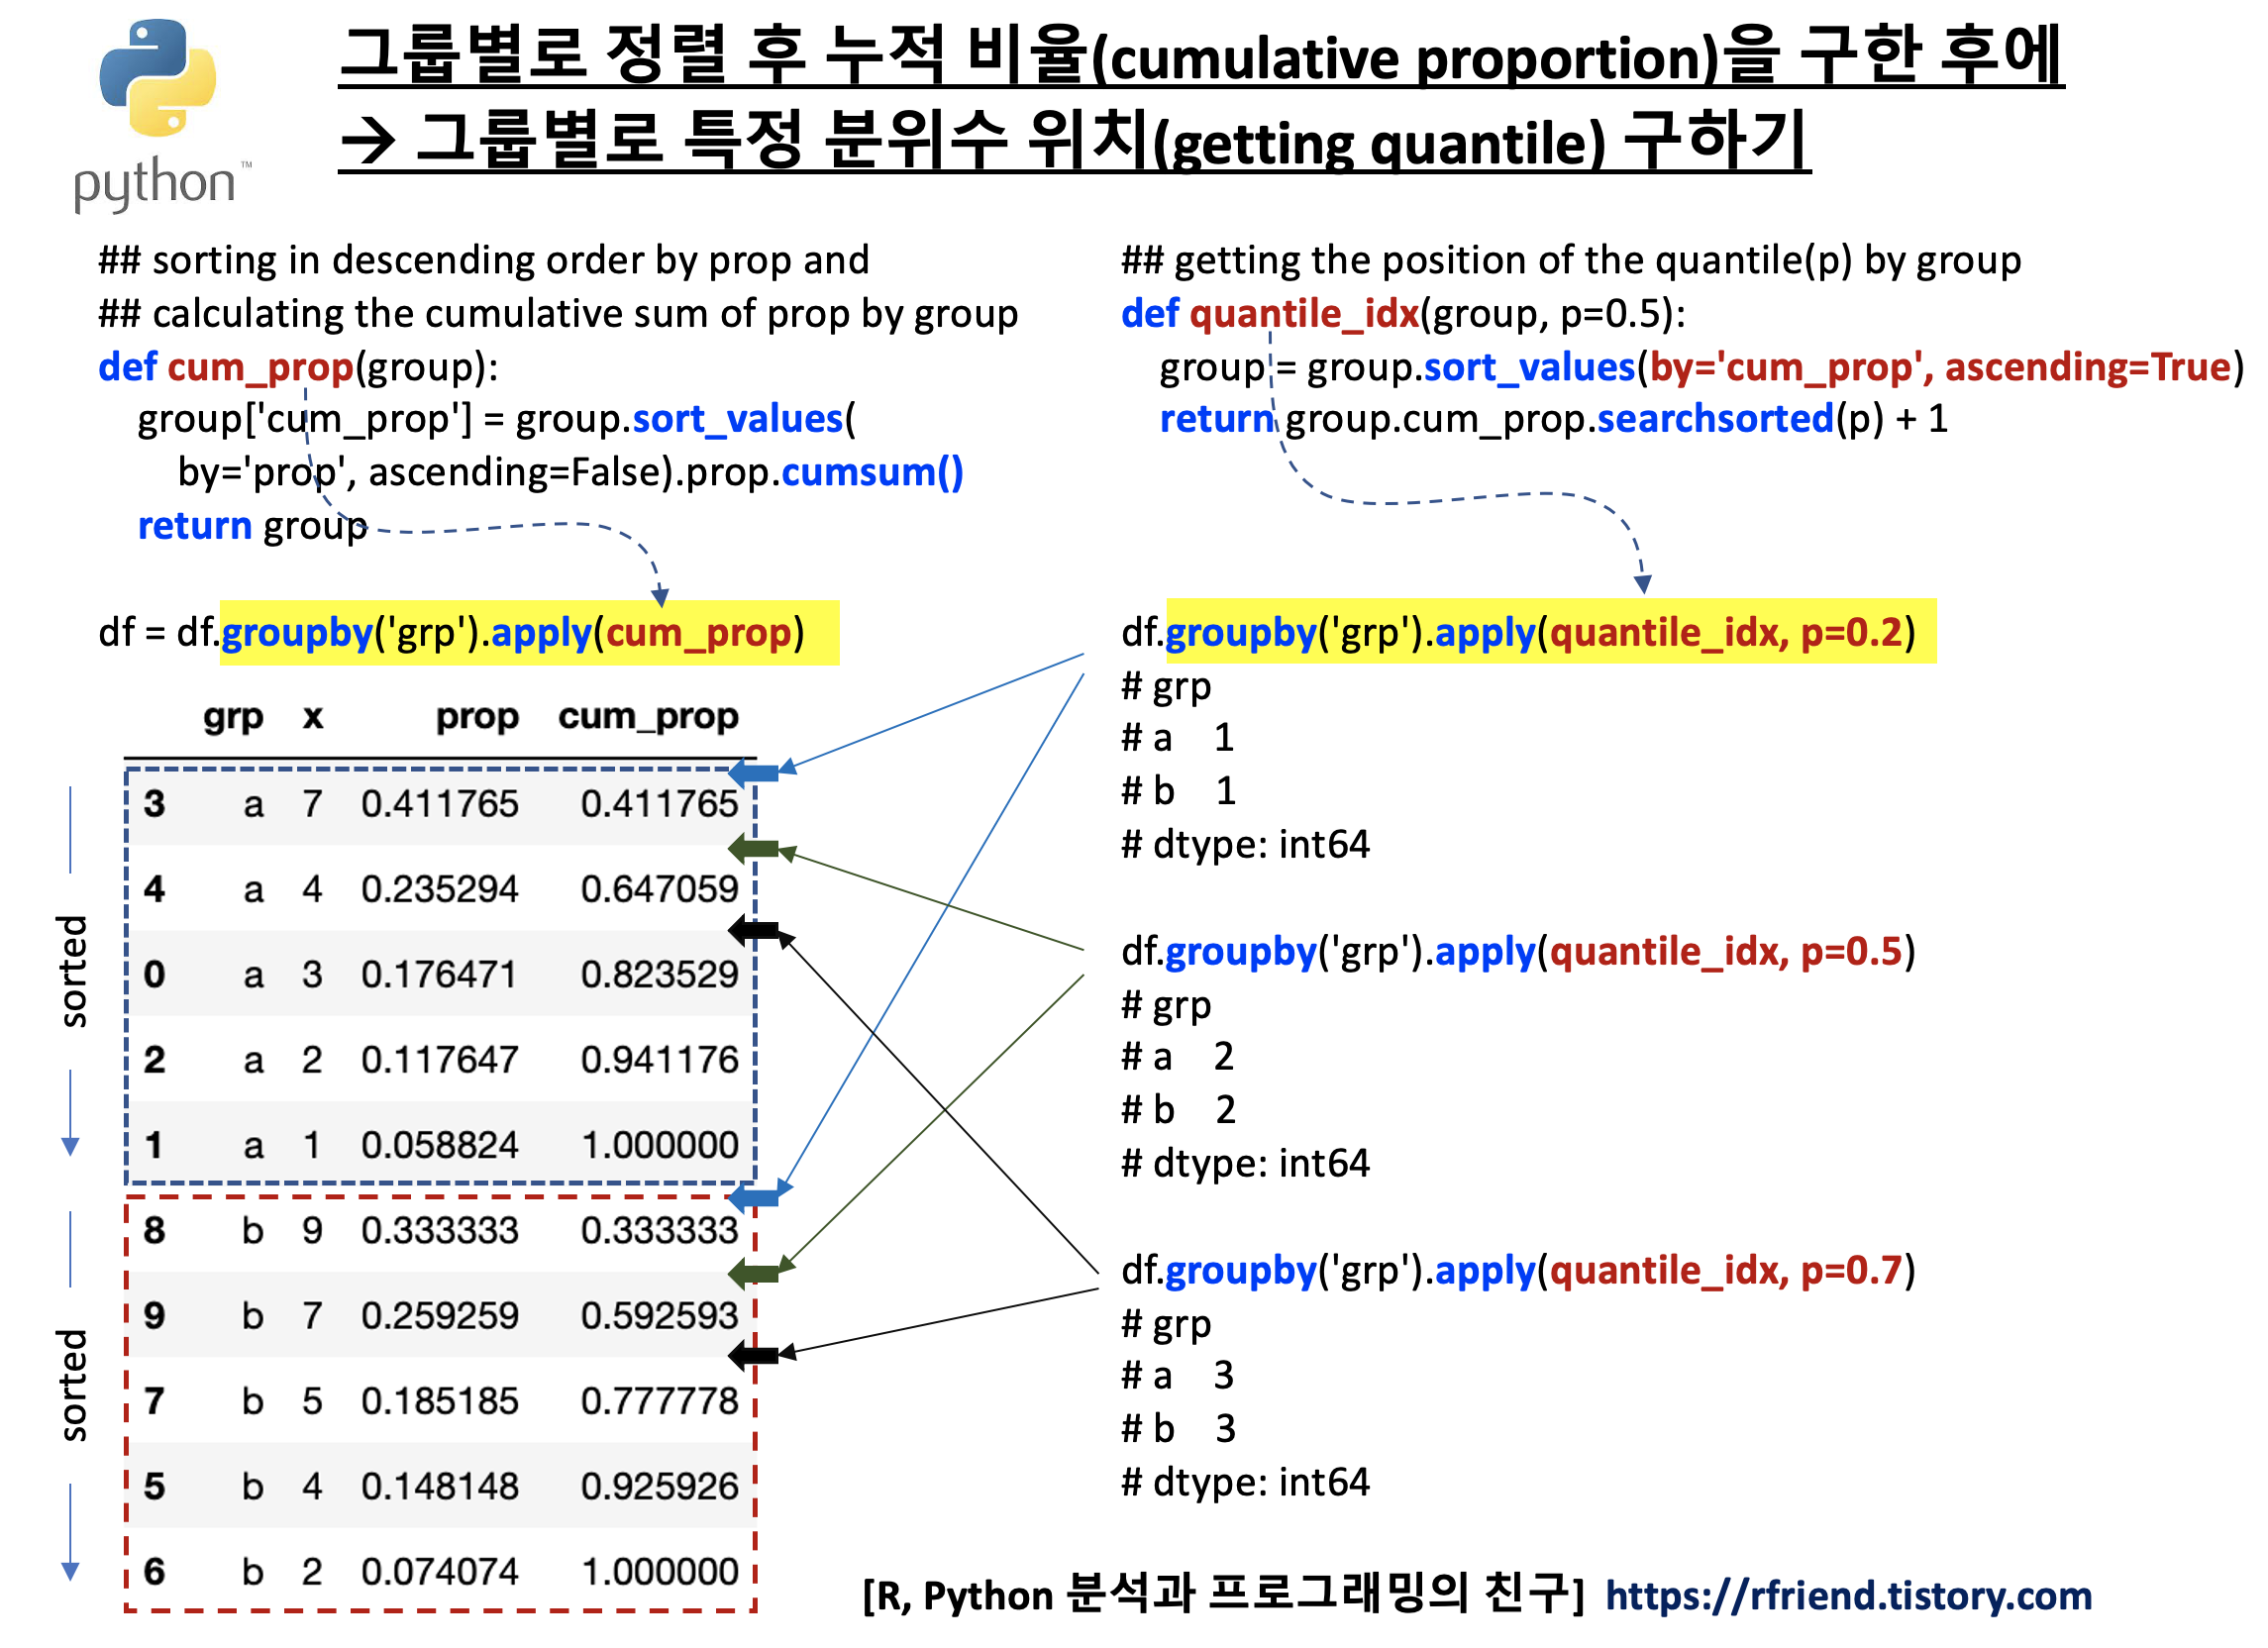
(1) 그룹별로 x 칼럼을 정렬 후 누적 비율을 구한 후 (calculating the cumulative proportion by groups)
(2) 그룹별로 특정 분위수의 위치 구하기 (getting the indices for a specific quantile p by groups)
하는 방법을 소개하겠습니다.
그룹별로 연산을 수행하므로 pandas.DataFrame.groupby().apply(UDF) 형식으로 구문을 작성할 거예요.
[ pandas DataFrame에서 그룹별로 정렬 후 누적 비율을 구한 후에 --> 그룹별로 특정 분위수 위치 구하기 ]
먼저, 예제로 사용하기 위해 그룹('grp') 칼럼별 값('x')을 가지는 간단한 pandas DataFrame을 만들어보겠습니다.
import numpy as np
import pandas as pd

df = pd.DataFrame({
    'grp': ['a', 'a', 'a', 'a', 'a', 'b', 'b', 'b', 'b', 'b'],
    'x': [3, 1, 2, 7, 4, 4, 2, 5, 9, 7]})

print(df)
#   grp  x
# 0   a  3
# 1   a  1
# 2   a  2
# 3   a  7
# 4   a  4
# 5   b  4
# 6   b  2
# 7   b  5
# 8   b  9
# 9   b  7
(1) 그룹별로 x 칼럼을 정렬 후 누적 비율을 구한 후 (calculating the cumulative proportion by groups)
그룹별로 x 칼럼에 대한 누적 비율을 구하기 위해, 먼저 그룹별로 x 칼럼의 비율(proportion)을 계산해서 'prop' 라는 칼럼을 추가해보겠습니다. x_prop() 라는 사용자 정의 함수를 정의한 후, df.groupby('grp').apply(x_prop) 처럼 그룹에 apply() 메소드로 사용자 정의 함수를 적용해서 연산을 했습니다.
## adding the proportion column by group
def x_prop(group):
    group['prop'] = group.x / group.x.sum()
    return group

df = df.groupby('grp').apply(x_prop)


print(df)
#   grp  x      prop
# 0   a  3  0.176471
# 1   a  1  0.058824
# 2   a  2  0.117647
# 3   a  7  0.411765
# 4   a  4  0.235294
# 5   b  4  0.148148
# 6   b  2  0.074074
# 7   b  5  0.185185
# 8   b  9  0.333333
# 9   b  7  0.259259


## checking the sanity
df.groupby('grp').prop.sum()
#      grp
# a    1.0
# b    1.0
# Name: prop, dtype: float64
앞에서 계산한 그룹별 x 칼럼의 비율 'prop'을 그룹별로 내림차순(descending order)으로 정렬해서 보면 아래와 같습니다.
## sorting in descending order by prop
df.sort_values(by=['grp', 'prop'], ascending=False)

#     grp	x	prop
# 8	b	9	0.333333
# 9	b	7	0.259259
# 7	b	5	0.185185
# 5	b	4	0.148148
# 6	b	2	0.074074
# 3	a	7	0.411765
# 4	a	4	0.235294
# 0	a	3	0.176471
# 2	a	2	0.117647
# 1	a	1	0.058824
pandas 의 cumsum() 메소드를 사용해서 그룹별 x칼럼의 비율 'prop'의 누적 합계 (cumulative sum) 인 'cum_prop' 를 그룹별로 계산해보겠습니다. 역시 비율 'prop'에 대해서 누적 합계(cum_sum)를 구하는 사용자 정의 함수 'cum_prop()'를 먼저 정의한 후에, 이를 df.groupby('grp').apply(cum_prop) 처럼 apply() 메소드에 사용자 정의함수를 적용해서 계산했습니다.
## sorting in descending order by prop and calculating the cumulative sum of prop
def cum_prop(group):
    group['cum_prop'] = group.sort_values(
        by='prop', ascending=False).prop.cumsum()
    return group

df = df.groupby('grp').apply(cum_prop)


df.sort_values(by=['grp', 'cum_prop'])

#     grp	x	prop	        cum_prop
# 3	a	7	0.411765	0.411765
# 4	a	4	0.235294	0.647059
# 0	a	3	0.176471	0.823529
# 2	a	2	0.117647	0.941176
# 1	a	1	0.058824	1.000000
# 8	b	9	0.333333	0.333333
# 9	b	7	0.259259	0.592593
# 7	b	5	0.185185	0.777778
# 5	b	4	0.148148	0.925926
# 6	b	2	0.074074	1.000000
위의 예시는 간단한 편이므로 아래처럼 사용자 정의 함수를 정의하는 대신에 apply() 메소드 안에 바로 lambda 로 'prop'에 대해서 내림차순 정렬 후 누적 합계를 구하는 함수를 바로 써줘도 됩니다.
## or, equivalentsly, using lambda function for cumulative proportion
df.groupby('grp').apply(lambda x: x.sort_values(by='prop', ascending=False).prop.cumsum())

# grp
# a    3    0.411765
#      4    0.647059
#      0    0.823529
#      2    0.941176
#      1    1.000000
# b    8    0.333333
#      9    0.592593
#      7    0.777778
#      5    0.925926
#      6    1.000000
# Name: prop, dtype: float64
(2) 그룹별로 특정 분위수의 위치 구하기 (getting the indices for a specific quantile p by groups)
이제 위에서 구한 '그룹별 비율의 누적 합계('cum_prop')'에 대해서 pandas.Series.searchsorted(values, side='left') 메소드를 사용해서 특정 비율이 들어갈 위치를 구해보겠습니다.
비율에 대해 내림차순 정렬 후 누적 합계를 구한 값에 대해 특정 값이 들어갈 위치를 구하는 것이므로, 결과적으로 자료 크기 순서에 따른 위치값인 분위수(quantile) 를 구할 수 있게 됩니다. 인덱스가 '0'부터 시작하므로 위치를 구하기 위해서 반환받는 값에 '+1' 을 해주었습니다.
그룹별로 특정 분위수의 위치를 구하고 싶으므로, 분위수를 구하는 사용자 정의 함수인 'quantile_idx()' 함수를 정의한 후에, 이를 df.groupby('grp').apply(quantile_idx, p) 처럼 apply() 메소드에 사용자 정의 함수와 매개변수 p를 입력해서 적용해주면 되겠습니다.
그룹별로 분위수 p=0.2, p=0.5, p=0.7 인 곳의 위치를 구해보니 잘 작동하는군요.
## pandas.Series.searchsorted
## Series.searchsorted(value, side='left', sorter=None)[source]
## Find indices where elements should be inserted to maintain order.

def quantile_idx(group, p=0.5):
    group = group.sort_values(by='cum_prop', ascending=True)
    return group.cum_prop.searchsorted(p) + 1


## getting the index of quantile p=0.2 by group
df.groupby('grp').apply(quantile_idx, p=0.2)

# grp
# a    1
# b    1
# dtype: int64


## getting the index of quantile p=0.5 by group
df.groupby('grp').apply(quantile_idx, p=0.5)

# grp
# a    2
# b    2
# dtype: int64


## getting the index of quantile p=0.7 by group
df.groupby('grp').apply(quantile_idx, p=0.7)

# grp
# a    3
# b    3
# dtype: int64
[Reference]
* pandas.Series.searchsorted() method: https://pandas.pydata.org/docs/reference/api/pandas.Series.searchsorted.html
이번 포스팅이 많은 도움이 되었기를 바랍니다.
행복한 데이터 과학자 되세요! :-)

'Python 분석과 프로그래밍 > Python 데이터 전처리' 카테고리의 다른 글
| [Python] 실행 시간 측정하기 (measuring elapsed time in Python) (0) | 2021.11.17 |
|---|---|
| [Python] 리스트에서 원소별 개수를 세서 Dictionary를 만들고, 개수 상위 n개 가져오기 (0) | 2021.11.17 |
| [Python pandas] x를 기준으로 정렬 후 그룹별로 y의 첫번째 값, 마지막 값을 DataFrame에 추가하기 (0) | 2021.11.16 |
| [Python pandas] TimeStamp 행별로 칼럼별 비율을 구하고 시도표 그리기 (0) | 2021.11.14 |
| [Python BeautifulSoup] 웹 페이지 크롤링, 스크랩핑 (How to crawl, scrape web page using BeautifulSoup) (8) | 2021.09.29 |


