[Python matplotlib] 이중축 그래프 그리기 (plot with 2 axes)
Python 분석과 프로그래밍/Python 그래프_시각화 2021. 10. 2. 01:12이번 포스팅에서는 Python의 matplotlib 모듈을 사용하여, X축의 값은 동일하지만 Y축의 값은 척도가 다르고 값이 서로 크게 차이가 나는 2개의 Y값 데이터에 대해서 이중축 그래프 (plot with 2 axes for a dataset with different scales)를 그리는 방법을 소개하겠습니다.
먼저 간단한 예제 데이터셋을 만들어보겠습니다.
* x 축은 2021-10-01 ~ 2021-10-10 일까지의 10개 날짜로 만든 index 값을 동일하게 사용하겠습니다.
* y1 값은 0~9 까지 정수에 표준정규분포 Z~N(0, 1) 로 부터 생성한 난수를 더하여 만들었습니다.
* y2 값은 정수 0~9에 지수를 취하여 만들었습니다.
## importing modules
import numpy as np
import pandas as pd
import matplotlib.pyplot as plt


## generating sample dataset

np.random.seed(123) # for reproducibility
idx = pd.date_range("10 1 2021",
                     periods=10,
                     freq="d",
                     name="Date")

y1 = np.arange(10) + np.random.normal(0, 1, 10)
y2 = np.exp(range(10))

df = pd.DataFrame({'y1': y1,
                   'y2': y2},
                  index = idx)


print(df)
#                   y1           y2
# Date
# 2021-10-01 -1.085631     1.000000
# 2021-10-02  1.997345     2.718282
# 2021-10-03  2.282978     7.389056
# 2021-10-04  1.493705    20.085537
# 2021-10-05  3.421400    54.598150
# 2021-10-06  6.651437   148.413159
# 2021-10-07  3.573321   403.428793
# 2021-10-08  6.571087  1096.633158
# 2021-10-09  9.265936  2980.957987
# 2021-10-10  8.133260  8103.083928
먼저, 스케일이 다른 2개의 y값을 1개의 축을 사용하여 그렸을 때 문제점을 살펴보고,
다음으로 이를 해결하기 위한 방법 중의 하나로서 matplotlib을 사용해 2중축 그래프를 그려보겠습니다.
(* 참고로, 2중축 그래프 외에 서로 다른 척도(scale)의 두개 변수의 값을 표준화(standardization, scaling) 하여 두 변수의 척도를 비교할 수 있도록 변환해준 후에 하나의 축에 두 변수를 그리는 방법도 있습니다.)
(1) 스케일이 다른 2개의 y값 변수를 1중축 그래프에 그렸을 때 문제점
==> 스케일이 작은 쪽의 y1 값이 스케일이 큰 쪽의 y2 값에 압도되어 y1 값의 패턴을 파악할 수 없음. (스케일이 작은 y1값의 시각화가 의미 없음)
## scale이 다른 데이터를 1개의 y축만을 사용해 그린 그래프
fig = plt.figure(figsize=(12, 8))
ax = fig.add_subplot()

ax.plot(df.index, df.y1, marker='s', color='blue')
ax.plot(df.index, df.y2, marker='o', color='red')

plt.title('Plot with 1 Axis', fontsize=16)
plt.xlabel('Date', fontsize=14)
plt.ylabel('Value', fontsize=14)
plt.legend(['y1', 'y2'], fontsize=12, loc='best')
plt.show()
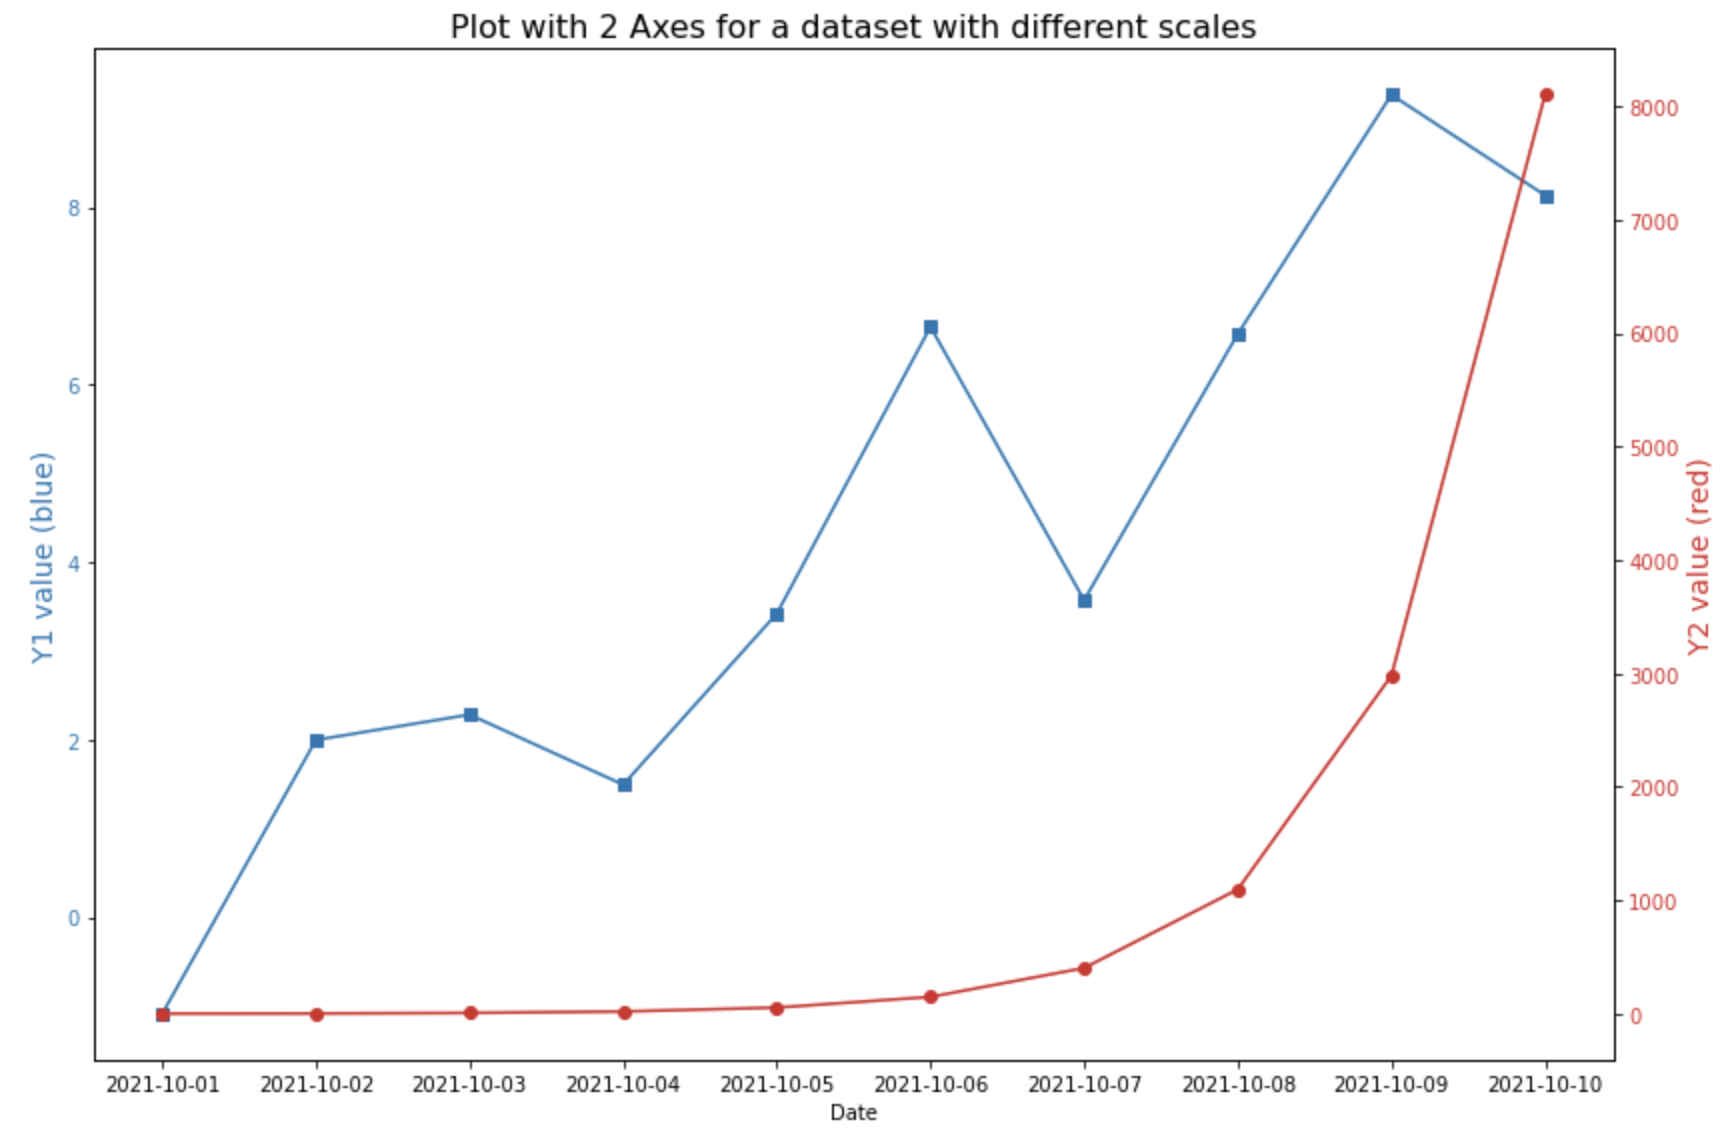
(2) 스케일이 다른 2개의 변수에 대해 2중축 그래프 그렸을 때
==> 각 y1, y2 변수별 스케일에 맞게 적절하게 Y축이 조정이 되어 두 변수 값의 패턴을 파악하기가 쉬움
이때, 가독성을 높이기 위해서 각 Y축의 색깔, Y축 tick의 색깔과 그래프의 색깔을 동일하게 지정해주었습니다. (color 옵션 사용)
## plot with 2 different axes for a dataset with different scales
# left side
fig, ax1 = plt.subplots()
color_1 = 'tab:blue'
ax1.set_title('Plot with 2 Axes for a dataset with different scales', fontsize=16)
ax1.set_xlabel('Date')
ax1.set_ylabel('Y1 value (blue)', fontsize=14, color=color_1)
ax1.plot(df.index, df.y1, marker='s', color=color_1)
ax1.tick_params(axis='y', labelcolor=color_1)

# right side with different scale
ax2 = ax1.twinx() # instantiate a second axes that shares the same x-axis
color_2 = 'tab:red'
ax2.set_ylabel('Y2 value (red)', fontsize=14, color=color_2)
ax2.plot(df.index, df.y2, marker='o', color=color_2)
ax2.tick_params(axis='y', labelcolor=color_2)

fig.tight_layout()
plt.show()
이번 포스팅이 많은 도움이 되었기를 바랍니다.
행복한 데이터과학자 되세요! :-)


