[Python] Plotly를 이용해서 클리브랜드 점 그래프 그리기 (Cleveland Dot Plot in Python using Plotly)
Python 분석과 프로그래밍/Python 그래프_시각화 2023. 6. 18. 22:33이번 포스팅에서는 Python의 Plotly 모듈을 이용해서 클리브랜드 점 그래프 (Cleveland Dot Plot in Python using Plotly) 그리는 방법을 소개하겠습니다.
Cleveland and McGill (1984) 이 “Graphical Methods for Data Presentation: Full Scale Breaks, Dot Charts, and Multibased Logging.” 이라는 논문에서 막대 그래프 대비 점 그래프가 데이터 해석, 가독성에서 가지는 우수성을 소개하면서 Cleveland Dot Plot 이라고도 많이 불리는 그래프입니다.
예제로 사용할 데이터로, "학교(schools)" 범주형 변수의 졸업생 별 남성(men)과 여성(women)의 수입(earning) 데이터로 pandas DataFrame을 만들어보겠습니다.
## making a sample pandas DataFrame
import pandas as pd

df = pd.DataFrame({
    'schools': [
        "Brown", "NYU", "Notre Dame", "Cornell", "Tufts", "Yale",
        "Dartmouth", "Chicago", "Columbia", "Duke", "Georgetown",
        "Princeton", "U.Penn", "Stanford", "MIT", "Harvard"],
    'earnings_men': [
        92, 94, 100, 107, 112, 114, 114, 118, 119, 124, 131, 137, 141, 151, 152, 165],
    'earnings_women': [
        72, 67, 73, 80, 76, 79, 84, 78, 86, 93, 94, 90, 92, 96, 94, 112]
})


print(df)
#        schools  earnings_men  earnings_women
# 0        Brown            92              72
# 1          NYU            94              67
# 2   Notre Dame           100              73
# 3      Cornell           107              80
# 4        Tufts           112              76
# 5         Yale           114              79
# 6    Dartmouth           114              84
# 7      Chicago           118              78
# 8     Columbia           119              86
# 9         Duke           124              93
# 10  Georgetown           131              94
# 11   Princeton           137              90
# 12      U.Penn           141              92
# 13    Stanford           151              96
# 14         MIT           152              94

# 15     Harvard           165             112
Plotly 의 graph_objects 메소드를 사용해서 졸업한 학교(schools) 별 남성의 수입(earnings_men)과 여성의 수입(earnings_women) 에 대해서 점으로 마킹을 하고 수입을 텍스트로 표기 (mode="markers + text") 하여 클리브랜드 점 그래프 (Cleveland Dot Plot)을 그려보겠습니다.
import plotly.graph_objects as go

fig = go.Figure()

## Dot Plot for Men
fig.add_trace(go.Scatter(
    x=df['earnings_men'],
    y=df['schools'],
    marker=dict(color="red", size=10),
    mode="markers + text",
    name="Men",
    text=df['earnings_men'],
    textposition="middle right"
))

## Dot Plot for Women
fig.add_trace(go.Scatter(
    x=df['earnings_women'],
    y=df['schools'],
    marker=dict(color="blue", size=10),
    mode="markers + text",
    name="Women",
    text=df['earnings_women'],
    textposition="middle left"
))

## title and axis title
fig.update_layout(
    title="Earnings by School and Gender",
    xaxis_title="Annual Salary (in thousands)",
    yaxis_title="School")


fig.show()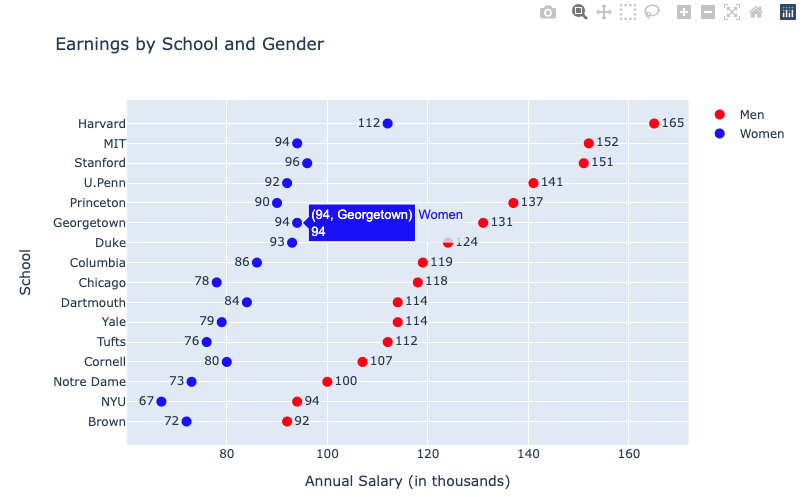
Plotly 그래프는 interactive mode 로서 마우스 커서를 그래프에 가져다대면 해당 점의 정보가 팝업으로 나타나서 편리하게 볼 수 있습니다.
R의 ggplot2 패키지를 이용한 클리브랜드 점 그래프 (Cleveland Dot Plot in R using ggplot2) 그리는 방법은 https://rfriend.tistory.com/75 를 참고하세요.
이번 포스팅이 많은 도움이 되었기를 바랍니다.
행복한 데이터 과학자 되세요! :-)